


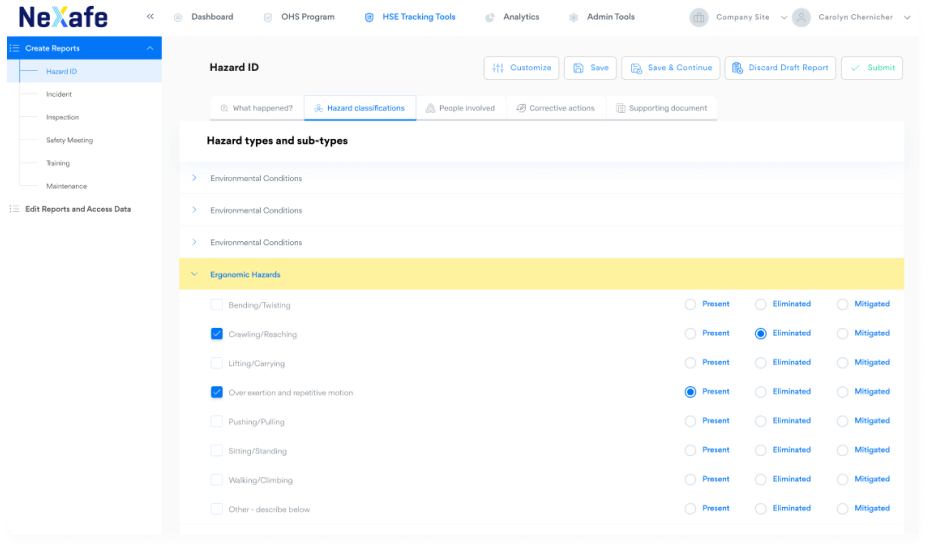
OHS assessment data is only helpful if you can record, access and work with it quickly.


“With NeXafe, we've improved tracking certification and competency deficiencies while reducing administrative costs. Since we have started using NeXafe, we are almost 100% more compliant.”
Marlaina Huery, Coordinator | Decca Consulting Ltd. 
“NeXafe’s StellarHSE allows us to gain efficiency and consistency. Our team can input, track, trend, and report on OHS leading/lagging indicators in real-time; no more tracking on paper or in spreadsheets. We can also customize tools and reports to reflect our needs and reality.”
Brent Odenbach, HSEQ Manager – Western Canada | Skyway Canada Ltd 
“NeXafe has allowed us to precisely manage all our worker requirements for every client we work for. Gone are the spreadsheets of yesterday. Having a system that is automatic, using smartphone technology, has been incredible. It was shocking how quickly our worker compliance and due diligence changed, with less manual administration time than before. I could not imagine moving forward and growing without NeXafe!”
Marlin Redpath, President | Stratum Group Ventures 
“NeXafe leads the industry in technology for worker-qualification tracking. The support team staff has been exceptional, and they work to meet my group's specific requirements. I recommend NeXafe as a professional and reliable source for safety ticket tracking. Using NeXafe has given me a tool to further my confidence that the workers on my job site have proper and up-to-date training.”
Marc Miller, Construction Manager | Canadian Natural Resources Ltd 
“NeXafe has really helped us to ensure that each worker is deemed competent to perform work safely. We’ve been using it for the last five years, and it’s definitely the most productive way to track training validity and monitor safety certifications.”
Tyler Heathcote, President | Ridgeline Canada Inc 
“Without a doubt, NeXafe provides peace of mind. The ability to filter individual employees on various projects while taking requirements into account has allowed us to meet and exceed regulatory and client conditions in all industries.”
Robert Price, NCSO, BAJS, Gestionnaire SST | Broda Group LP 
“The task of managing safety ticket expiry dates is time-consuming, cumbersome, and difficult to operate proactively; the NeXafe system allows us to fulfill this obligation while at the same time maximizing the time of our Health and Safety staff for additional vital duties. Work Smart, Work Safe is our mantra; NeXafe helps us to fulfill our pledge. NeXafe has been of extreme value to the organization and the customer service has also been A1.”
Kevin Vallee , NCSO, Gestionnaire SST | Summit Liability Solutions Inc 
“With NeXafe, I don’t have to worry about being up to date. Critical information is well-maintained, easy to read and search, and accessible in a user-friendly manner, from any locale. It’s a one-stop-shop solution, and it’s reasonably priced as well.”
Harry Hooi, Business Development and Engineering Consultant | Muddy Petroleum Company Ltd. 
“NeXafe is a quantum leap for OHS software. It’s straightforward, and people in the field understand it. Also, the overall support provided by the Customer Care team has been fantastic!”
Darcy Phillips, CRSP, Field Safety Coordinator | Tundra Oil and Gas Ltd.
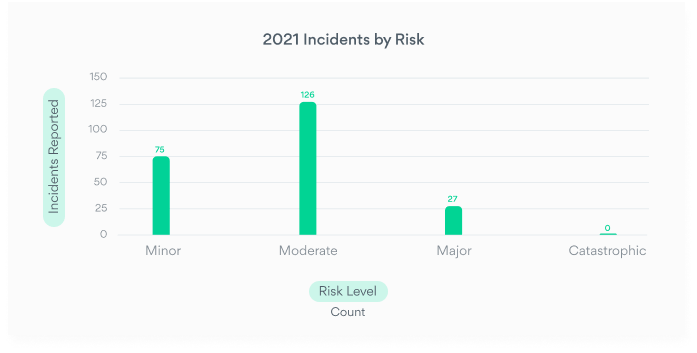
“With NeXafe, we’ve been better able to manage our incidents, complete tracking and trending, and export all required data for quick charting. This allows us to identify gaps quickly, and in turn, we’ve spent more time on being proactive, rather than taking a reactive approach. We’re able to focus more on what’s important: incident and injury prevention.”
John Stevens, Health, Safety & Wellness Manager | The City of Lloydminster